Kenai River Late-Run Sockeye Escapement
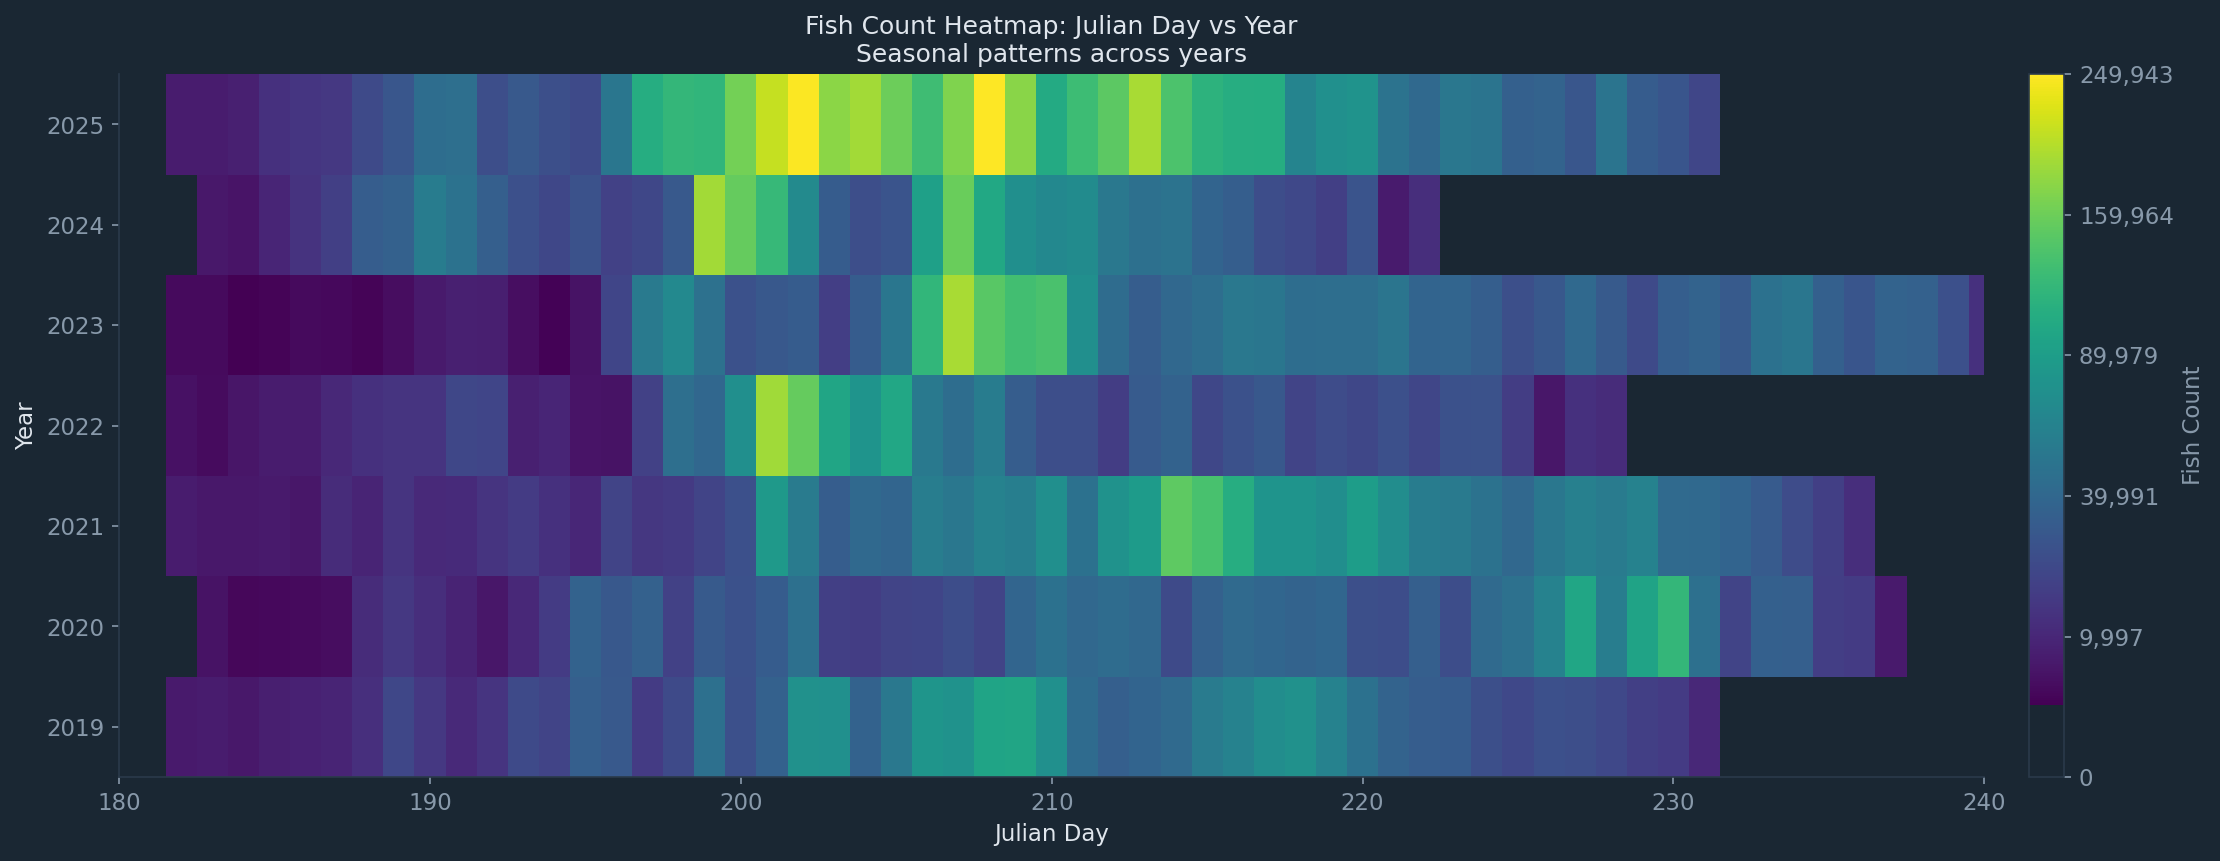
Daily fish passage counts are pulled from the Alaska Department of Fish & Game sonar station on the Kenai River (station 40, sockeye species 420). Each run fetches the full record back to 2019 and recomputes all three visualizations.
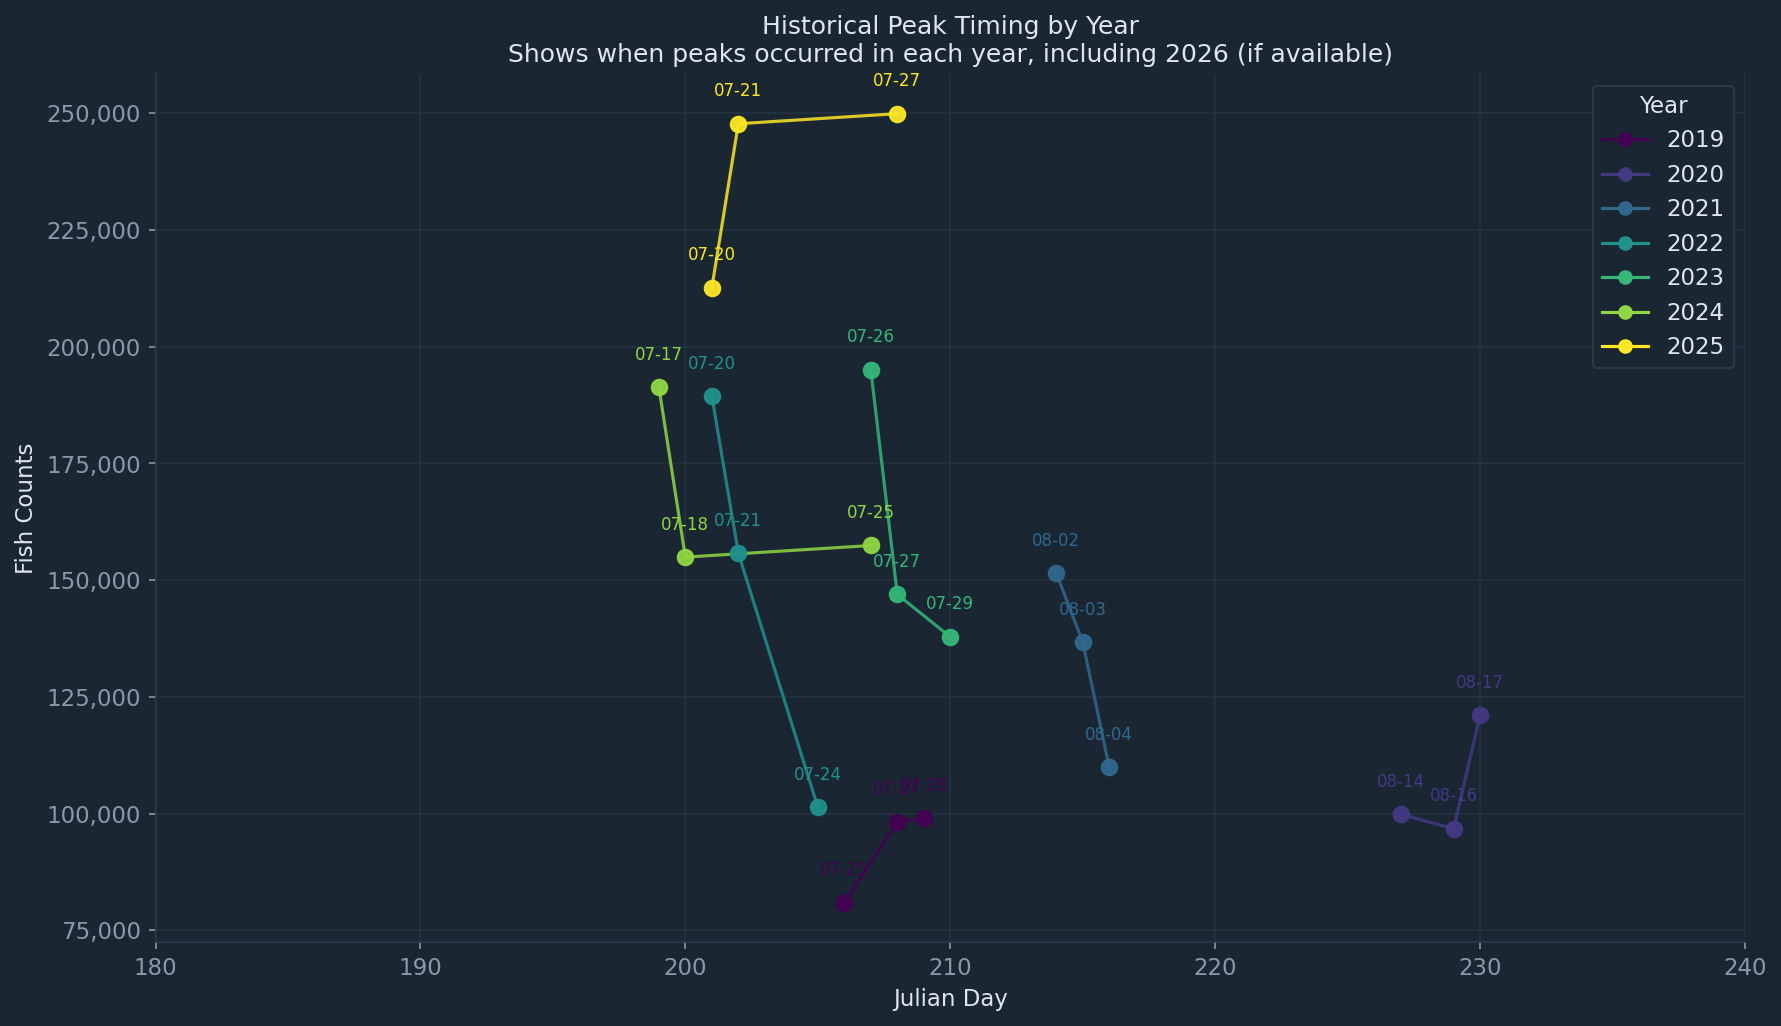
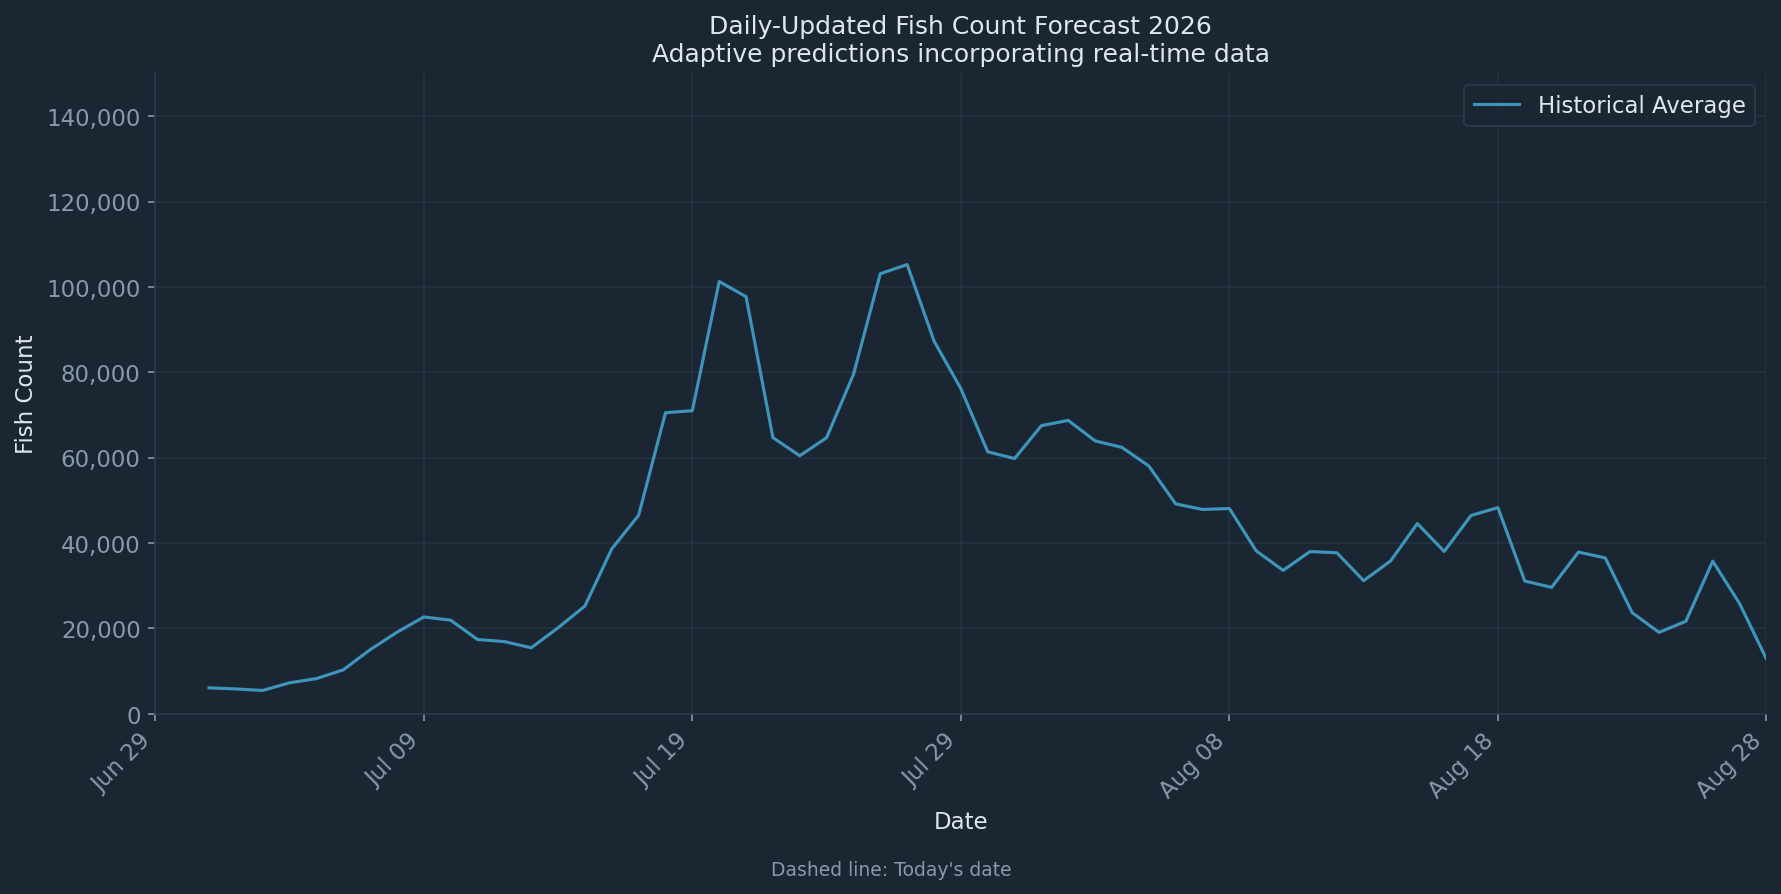
Peak timing is forecast using an Exponential Smoothing State Space (ETS) model fit to historical daily averages for the July–August window. ETS is well-suited here because the salmon run follows a consistent bell-curve pattern each year with no long-term trend—simple exponential smoothing captures the shape without overfitting. Once current-year counts start arriving, the model's predictions are scaled by the ratio of observed-to-historical performance over the most recent five days, letting the forecast adapt in real time as the run develops.